Build Salesforce reports on flair data
flair stores all HR and recruiting data in Salesforce, so you can also analyze it with standard Salesforce reports and dashboards. Use them when you need something flair Reports don't offer, such as a dashboard with several charts, a report subscription by email, or a report across your own custom objects. For everyday HR questions, start with flair Reports instead.
HR Admins and Recruiters with access to reports in Salesforce. Available records depend on Salesforce permissions. Creating dashboards and report folders depends on your Salesforce user permissions.
Run a Salesforce report included with flair
The flair package includes ready-made Salesforce reports in two report folders:
| Folder | Reports |
|---|---|
| Flair HR | Average Age of Employees, Employee Goals, Employees by Positions, Employees with Department, Employees with Location, Expenses by Employees, Full-Time Equivalent by Department, Gender of Employees, Number of active employees, Number of employees, Number of Employees on Trial Period, Number of Employees' Nationalities, Number of Leaving Employees, Type of employment, Type of time commitment, Years of Service |
| Flair Hire | Candidates by Application Source, Candidates Over Time, Ongoing Candidates Funnel |
- Open the App Launcher (⋮⋮ grid icon), search for
Reports, and open Reports. - Under Folders, click All Folders, and open Flair HR or Flair Hire.
- Click a report. Salesforce runs it and shows the results.
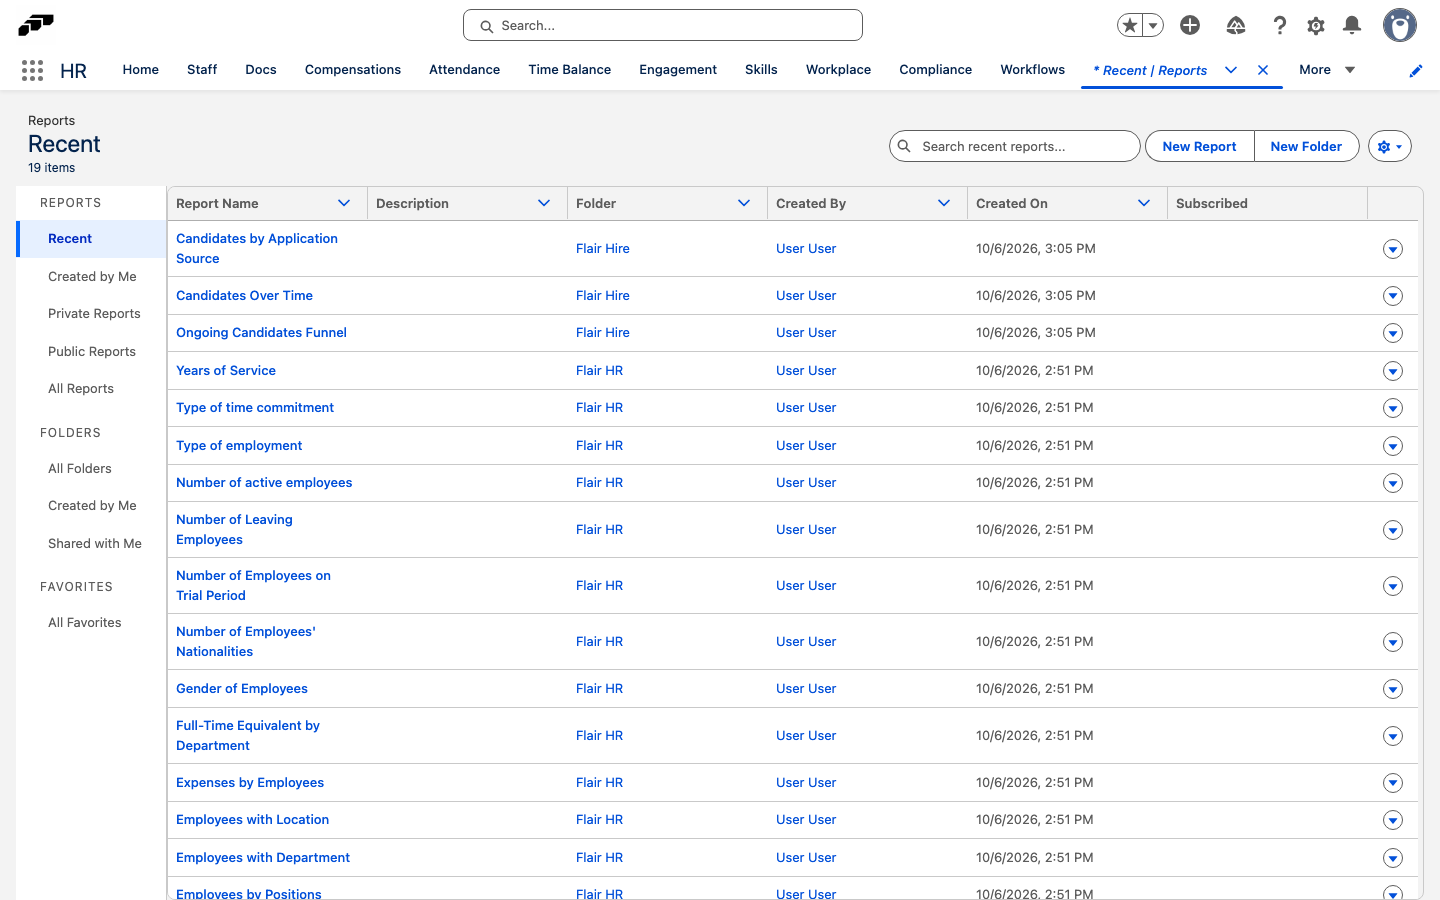
Most of these reports also appear on the Metrics tab when you select Salesforce in Type.
To change a packaged Salesforce report, open it, click the arrow next to Edit, and select Save As. Save the copy to your own folder, and change the copy. The original report stays unchanged when the flair package updates.
Choose a report type for flair data
Every Salesforce report starts from a report type, which decides the objects and fields available. In addition to the standard report types for each flair object, the flair package includes report types that combine related records:
| Report type | Use it for |
|---|---|
| Absences with Absence Days with Allowance Withdrawal Days | Absence days and how they're deducted from allowances |
| Employee Absence Categories with Absence Allowances with Allowance Withdrawal Days | Allowances per employee and absence category |
| Employee with Employee Objectives | Objectives per employee |
| Employees with Workflows with Workflow Tasks | Onboarding and offboarding progress per employee |
| Employees with Employee Shifts with Employee Shift Time Entries | Planned shifts compared with tracked time |
| Employees with Employee Shifts with Timesheet Day Employee Shifts | Planned shifts per timesheet day |
| Expenses by Employees | Expenses per employee |
| Payroll Runs with Employee Payroll Runs with Employee Payroll Run Notes | Payroll runs and their notes per employee |
| Approval Policies with Approval Policy Steps with Approval Policy Step Approvers | Who approves at each step of an approval policy |
| Timesheets with Timesheet Days with Timesheet Day … | Timesheet days with their absences, shifts, holidays, project time entries, time entries, or workloads |
Example: Average salary by country and employment type
This example builds a matrix report of average salaries per country and type of employment.
Create the report
- Open the App Launcher (⋮⋮ grid icon), search for
Reports, and open Reports. - Click New Report.
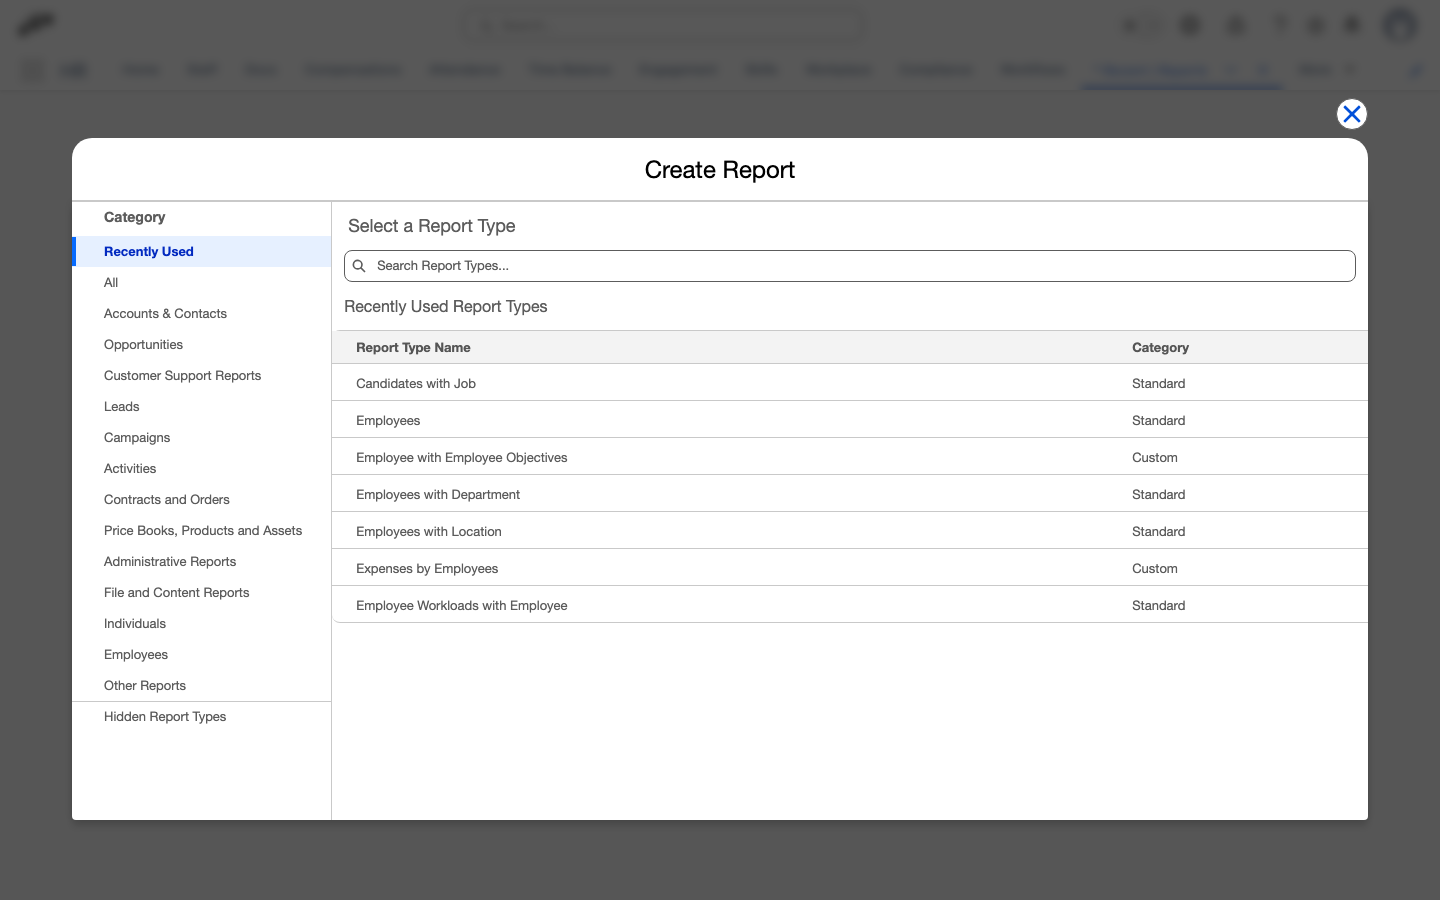
- In Report Types, click All.
- In the search field, enter
Salaries. - Select Employee Salaries with Employee, and click Start Report. The Report Builder opens.
- Enable Update Preview Automatically to show changes as you build the report.
Add the columns
- In Columns, find Employee Salary ID, and click X to remove it.
- In Add Column, add Amount, Employee: Country, Employee: Department, and Employee: Type of Employment.
- Optional: Drag a column heading to change its position.
Group and summarize
- In the Employee: Country column heading, click the down arrow, and select Group Rows by This Field. Salesforce shows the record count and an Amount subtotal per country.
- In the Amount column heading, click the down arrow, and select Summarize → Average.
- In the Employee: Type of Employment column heading, click the down arrow, and select Group Columns by This Field. The report becomes a matrix of average salaries by country and employment type.
- Optional: At the bottom of the builder, turn Row Counts, Detail Rows, Subtotals, and Grand Total on or off.
Filter, save, and run
- In the left menu, open Filters.
- In Add Filter, search for
Active, select Employee: Active, choose True, and click Apply. The report includes only active employees. - Click Save, enter a report name, select a folder, and save the report.
- Click Run. Salesforce shows the complete results.
Salesforce explains more display options in Filter Report Data.
Add flair data to a dashboard
Salesforce dashboards combine several reports on one page, for example headcount, leavers, and candidates per source for a monthly HR review.
- Open the App Launcher (⋮⋮ grid icon), search for
Dashboards, and open Dashboards. - Click New Dashboard, enter a name, select a folder, and click Create.
- Click + Component, select a report such as Number of employees from Flair HR, and choose a chart type.
- Click Add, then repeat for other reports, such as Number of Leaving Employees and Candidates by Application Source.
- Click Save, then Done.
Salesforce describes dashboard options in Build a Dashboard.