Use Analytics in the Employee Hub
Analytics in the Employee Hub brings flair Reports to employees and managers without Salesforce access. Employees see reports about their own data, such as their working hours and absences. Managers also see reports about their team, and hiring managers see reports about the jobs they hire for. HR Admins decide which reports appear and how each one is scoped.
Employees and Managers in the Employee Hub. HR Admins publish reports and set their scope and visibility in Salesforce.
Browse the report library
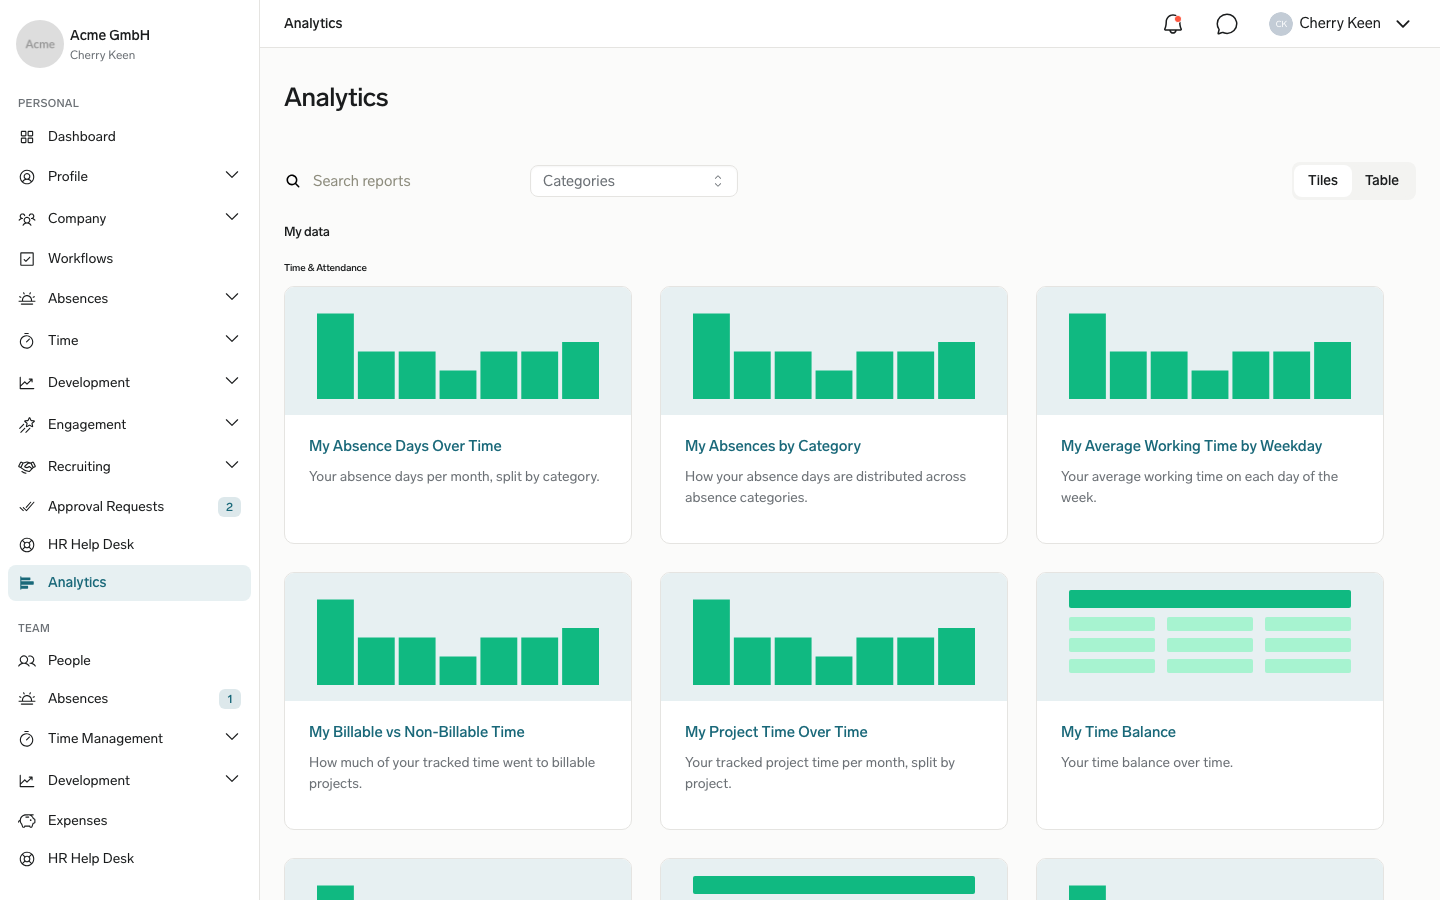
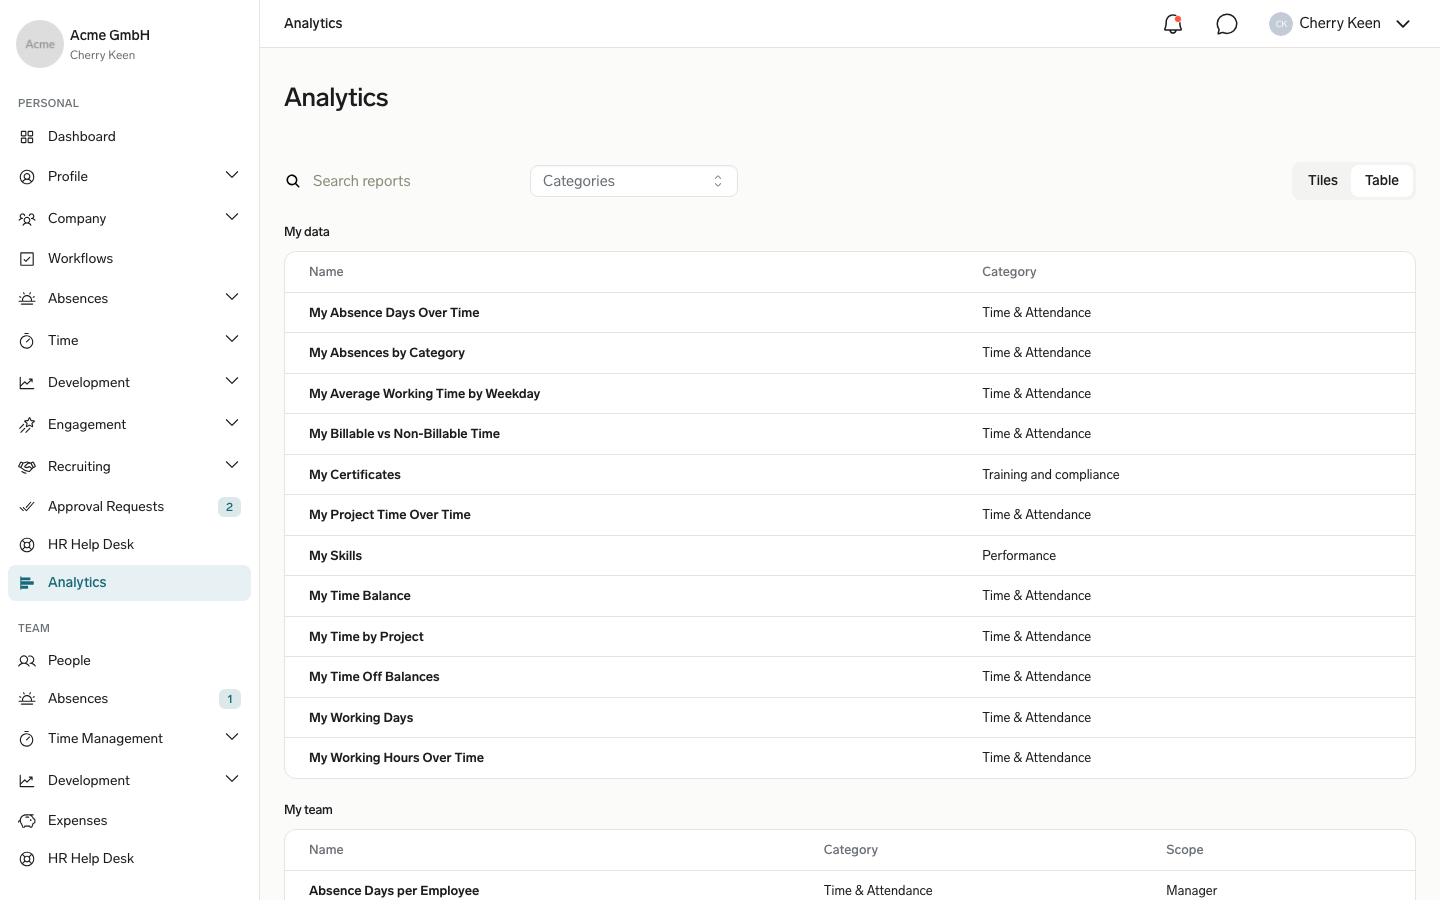
- In the Employee Hub, open Analytics. The library shows two sections: My data with reports about you, and My team with reports about the people you manage or the jobs you hire for.
- To switch between cards and a list, use the Tiles and Table toggle.
- Optional: To find a report, enter part of its name or description in Search reports.
- Optional: To show only some subcategories, such as Time & Attendance or Hiring, select them in Categories.
- Click a report to open it.
In My team, a badge on each report shows its scope, which decides whose data you see:
| Badge | Data in the report |
|---|---|
| Manager | Your direct reports and the employees you're an HR manager for. |
| Hiring manager | Candidates and jobs you're the hiring manager for. |
| Hiring evaluator | Candidates and jobs you evaluate. |
| Company-wide | All rows of the report, for example all employees. Your HR Admins limit who sees these reports. |
Adjust and read a report
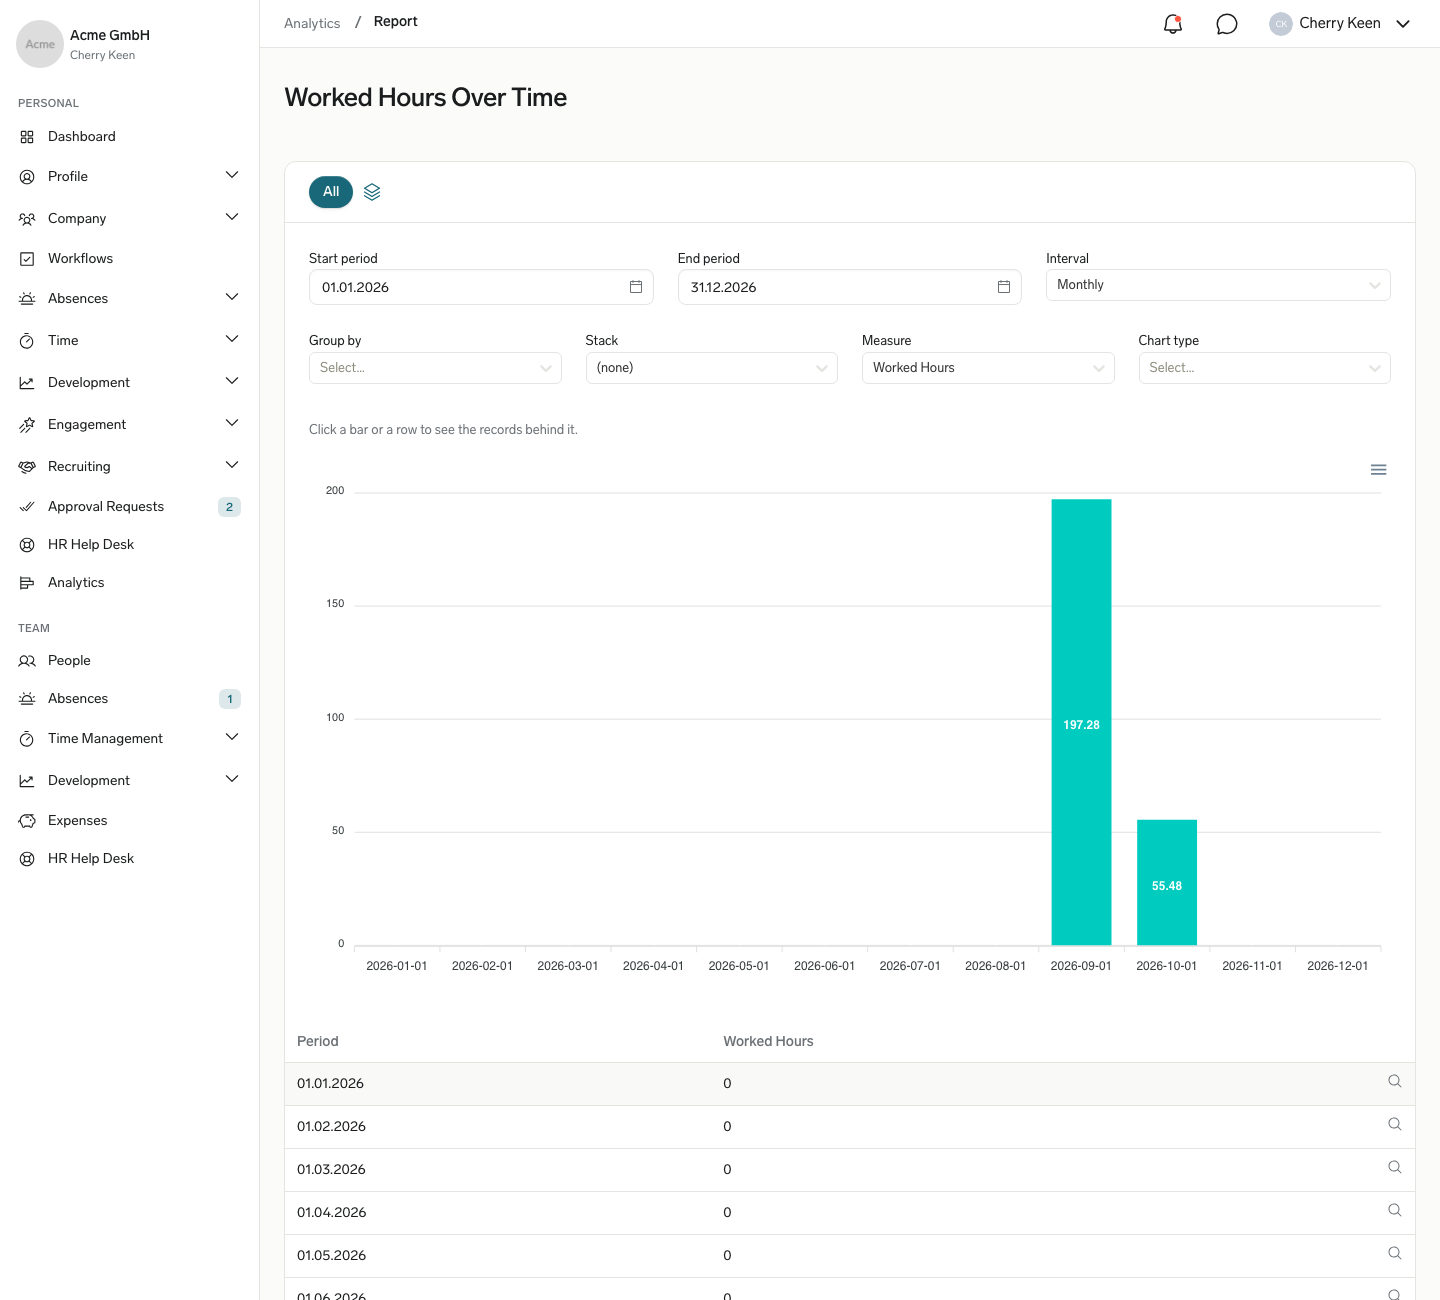
The controls a report offers depend on how it's built. A flat list shows a table only, while a grouped report adds grouping, measure, and chart controls.
- For a report over time, set Start period and End period. By default, a report shows the current calendar year. When the report is grouped by time, also select an Interval of Monthly, Quarterly, or Annually.
- In Group by, select the field to group results by.
- Optional: In Stack, select a second field to split each group into series. Select (none) to remove stacking.
- In Measure, select the value to show, such as a count or a sum.
- In Chart type, select a chart. A report over time offers Line and Column. Other reports offer Column, Bar, and Pie, and Pie isn't available when the chart is stacked. Default uses the chart the report was built with.
The table below the chart lists the same results.
See the records behind a number
If a report shows Click a bar or a row to see the records behind it., you can inspect the records that make up each value.
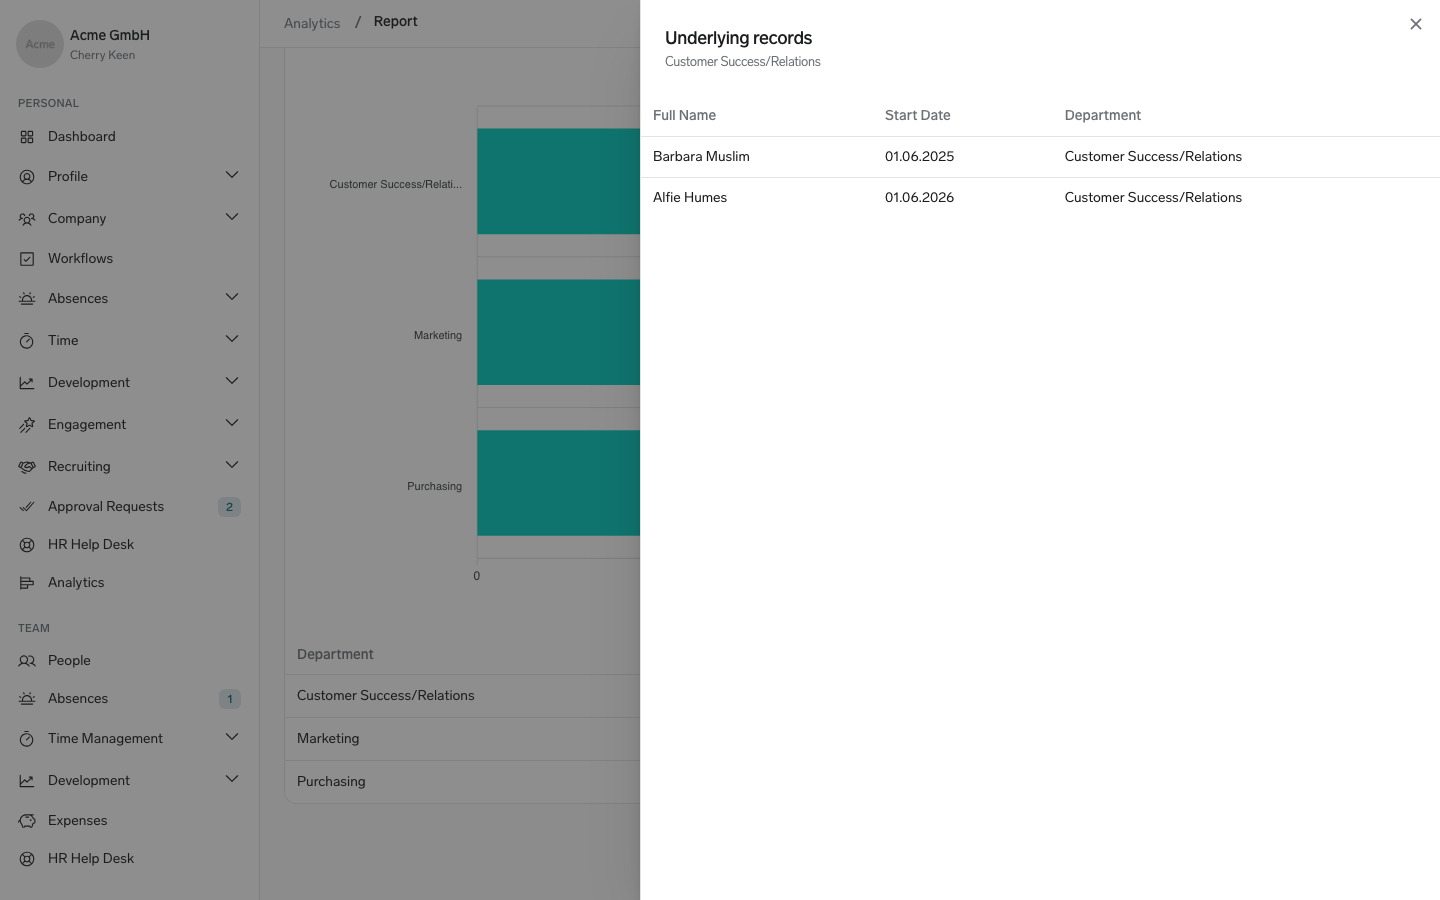
- Click a bar, column, or slice in the chart, or click the magnifying glass at the end of a table row.
- Review the records in Underlying records. The drawer shows up to the first 200 records.
- Close the drawer. It also closes when you change the period, grouping, or measure.
Download a chart
- Open the menu icon (☰) in the top-right corner of the chart.
- Select Download SVG or Download PNG to save the chart as an image, or Download CSV to save the chart data.
Reports without a chart can't be downloaded in the Employee Hub. To export full report data, ask an HR Admin to export it from Salesforce.
Save and reuse a view
A view stores your period, grouping, measure, and chart choices for a report, so you can return to them without setting them up again. Views are personal: other employees don't see them.
- Set up the report the way you want to keep it.
- In the views bar, click the stack icon (New view), enter a name, and click Save. The view appears as a button in the bar.
- To switch views, click All for the report's default settings, or click a saved view.
- After changing a saved view, click Save changes to update it.
- To rename, duplicate, or delete a view, open its actions menu (⋯), and select Rename, Duplicate, or Delete.
Publish a report to the Employee Hub
As an HR Admin, you decide which flair Reports appear in Analytics, whose data each one shows, and who sees it. Many packaged flair Reports are already available in the Employee Hub. Packaged reports meant for HR or Executives, such as the compensation reports, stay in Salesforce.
Make a report available in the Employee Hub
-
In Salesforce, open the flair Reports tab, and select the report you want to publish. If it's a draft, publish it first: the Employee Hub tab appears only on published reports.
-
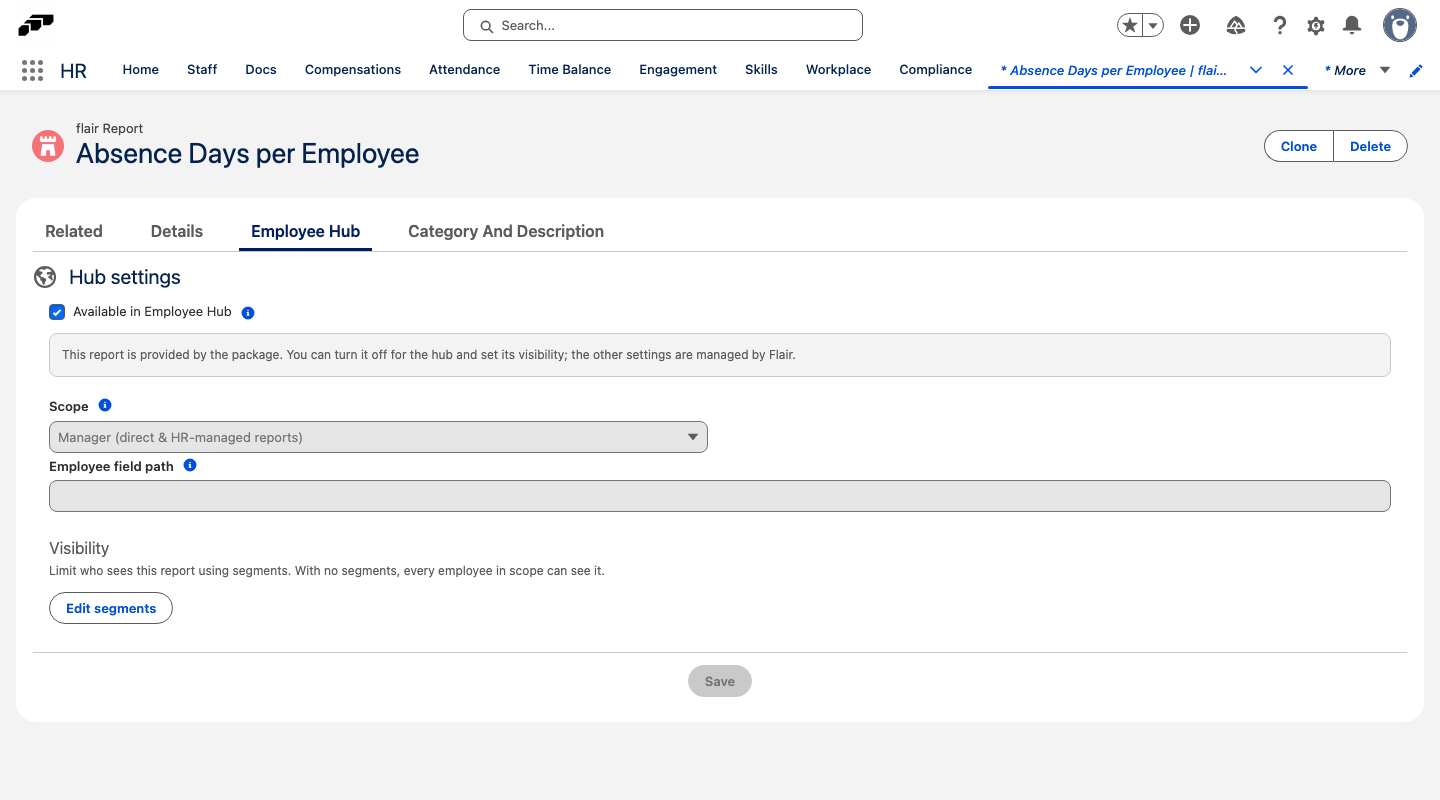
Open the Employee Hub tab on the report record.
-
Select Available in Employee Hub. The remaining Hub settings appear. For packaged reports, you can change only Available in Employee Hub and Visibility; flair manages the other settings.
-
Open the Category And Description tab, and select a Category. The category determines which Scope options are available.
-
Return to the Employee Hub tab. In Scope, choose how the report rows are limited:
Scope Rows available to the viewer Section in Analytics Personal (own data) The viewer's own records. My data Manager (direct & HR-managed reports) The viewer's direct reports and employees they manage through HR access. My team Hiring Manager (candidates & jobs you hire for) Candidates and jobs connected to the viewer's hiring responsibilities. My team Hiring Evaluator (candidates & jobs you evaluate) Candidates and jobs connected to the viewer's evaluation responsibilities. My team Dangerously show everything All report rows. Use Visibility segments to control who can see the report. My team -
For Personal (own data), Manager (direct & HR-managed reports), or Dangerously show everything, open the Category And Description tab and select Employee and/or Manager in Audience. Reports with a hiring scope don't need an audience. Without Employee or Manager in Audience, a report using one of the first three scopes doesn't appear in the Hub.
-
Optional: For your own reports on objects other than Employee, fill in Employee field path or Recruiting field path to tell flair which employee or job each row belongs to.
-
Optional: Under Visibility, click Edit segments, and add the Employee Segments that should see the report. If you add no segments, every employee within the selected scope can see it.
-
Click Save. The report appears in Analytics for people who meet its scope, audience, and visibility rules.
Dangerously show everything shows every row of the report to everyone who can see it, including salary or personal data the report reads. Always limit such reports with Visibility segments.
Set the report library details
- Open the Category And Description tab on the report record.
- Select a Subcategory. The Hub groups reports by Subcategory, which also appears in the Categories filter.
- Enter the report Description. This text appears under the report title in the Hub.
- Click Save.
Hide Analytics from employees
To remove Analytics from the Employee Hub menu, select Hide Analytics in an Employee Hub feature-menu view. This hides the menu item; it doesn't change which reports employees are allowed to see. For the steps, see Customize the Employee Hub feature menu.
Troubleshooting
Analytics shows No reports are available for you yet
No report in the Employee Hub matches your scope. My data shows personal reports. My team appears for managers, hiring managers, and hiring evaluators, and for anyone who can see a company-wide report.
A report shows This report is not available
The report was removed from the Employee Hub, or your scope or visibility no longer includes it. Contact your HR Admin.