Show metrics on records and Lightning pages
flair Reports also appear outside the report viewer, as compact widgets on Salesforce pages. The employee record includes a Metrics tab out of the box, and Salesforce Admins can add report widgets to any record, app, or home page.
HR Admins, Attendance Managers, and Absence Managers in Salesforce view the Metrics tab. Salesforce Admins embed reports with the Lightning App Builder.
View an employee's Metrics tab
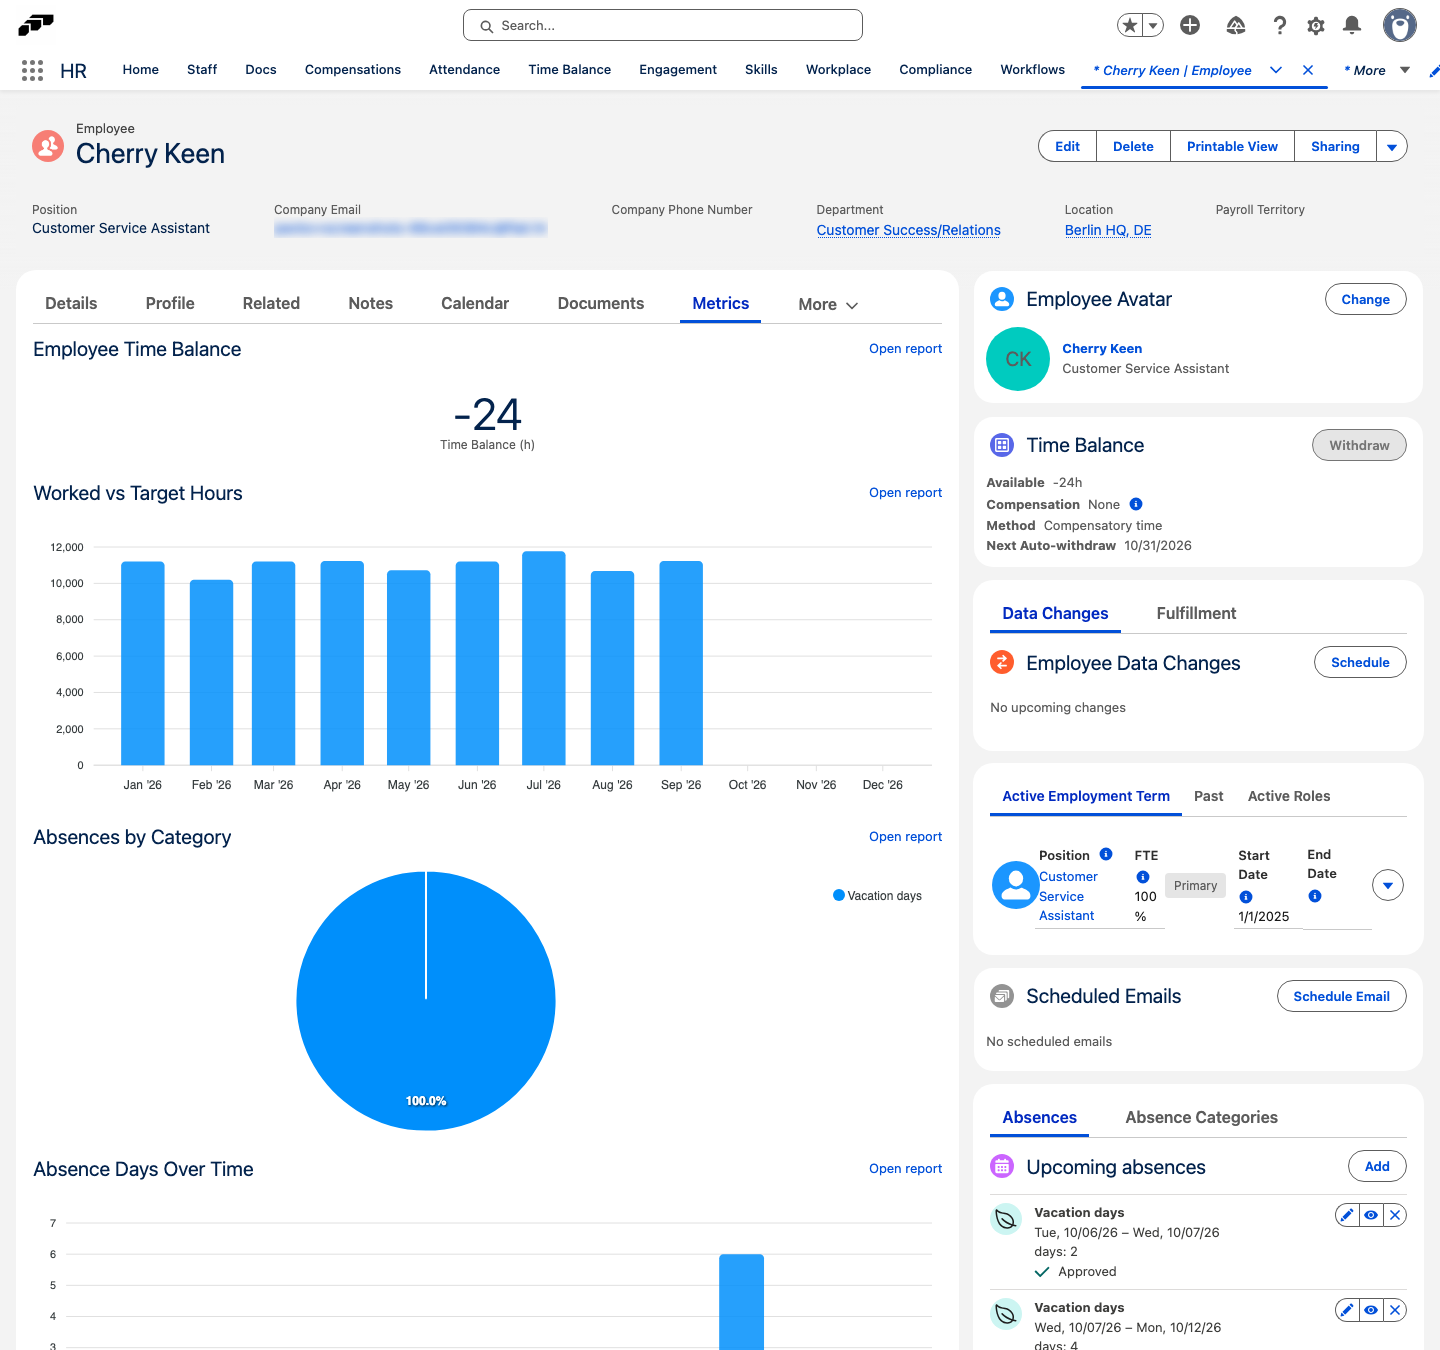
The Metrics tab on an employee record shows packaged flair reports as compact widgets, filtered to that employee.
-
In flair HR, open Employees, and select an employee.
-
Open the Metrics tab. The tab shows these widgets:
Widget What it shows Employee Time Balance The employee's time balance as a single number. Worked vs Target Hours Worked hours compared with target hours, as a chart. Absences by Category The employee's absences per absence category, as a chart. Absence Days Over Time The employee's absence days over time, as a chart. -
Optional: To open the full report, click Open report on a widget.
The time balance and worked-hours widgets require the HR Manager or Attendance Manager custom permission. The absence widgets require the HR Manager, Attendance Manager, or Absences Manager custom permission. Users with none of these permissions see a missing-permission message on the tab.
If your organization customized the Employee record page, the Metrics tab isn't added automatically. A Salesforce Admin can add it, or individual report widgets, in the Lightning App Builder.
Embed a flair Report on a Lightning page
Salesforce Admins can add a packaged flair report to a record, app, or home page as a chart, table, or single-number tile.
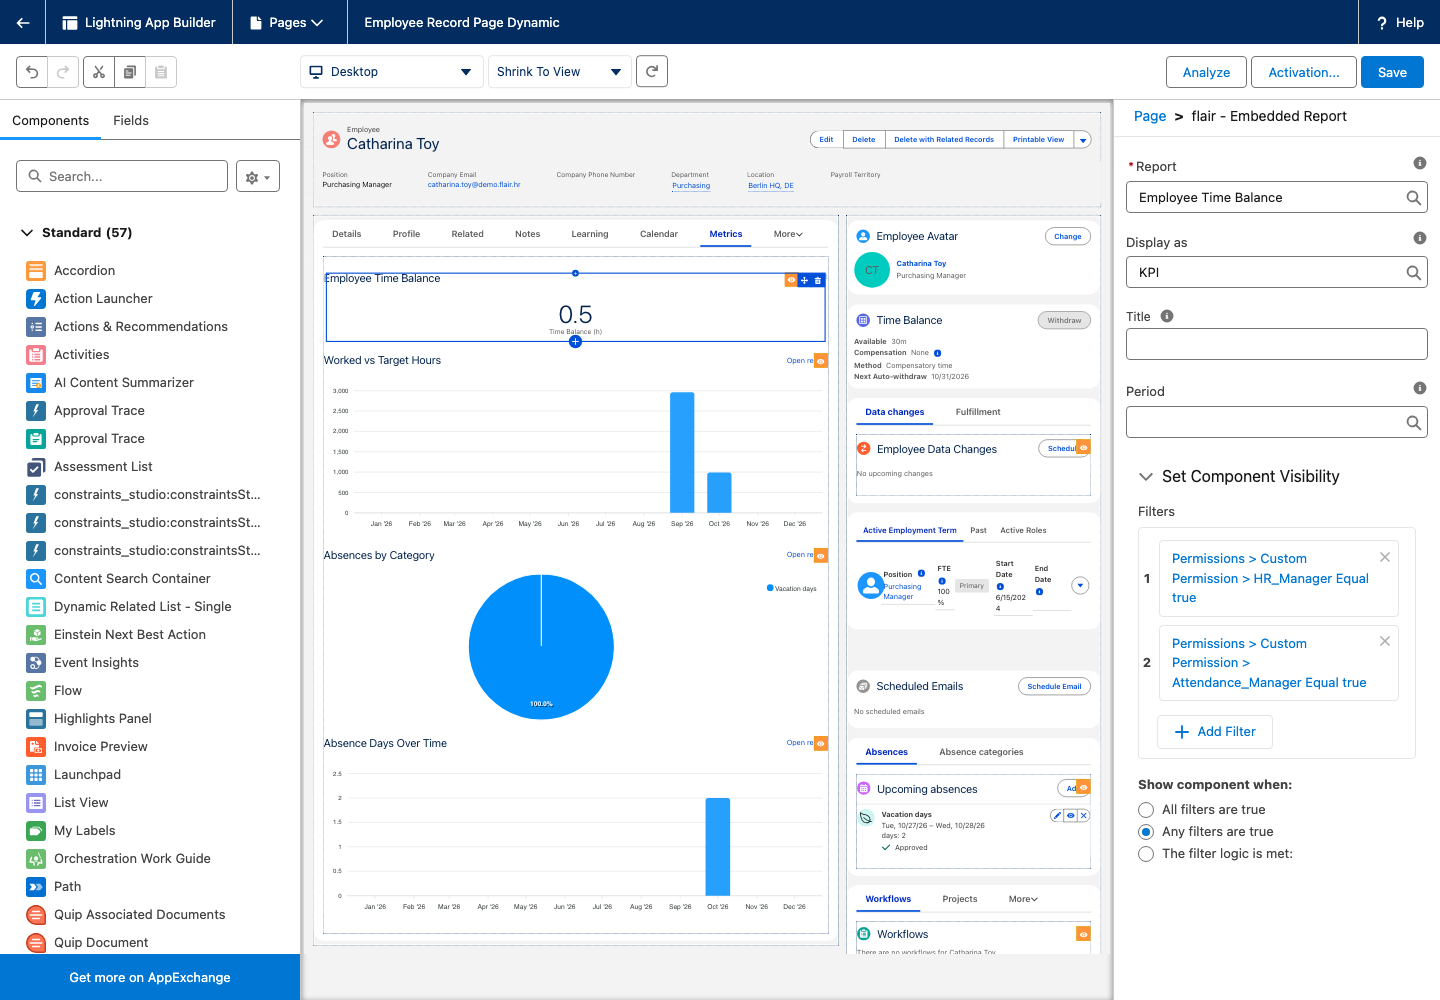
- Open the page to change, click the setup gear, and click Edit Page. The Lightning App Builder opens.
- From the component list, drag flair - Embedded Report onto the page.
- In Report, select the packaged report to show.
- In Display as, select CHART, TABLE, or KPI. A chart shows as a table when the report has no chart configured.
- Optional: In Title, enter a title. Leave it blank to use the report's own title.
- In Period, select CURRENT_YEAR, LAST_12_MONTHS, or CURRENT_MONTH. The period applies only to reports with a period dimension.
- Click Save, and activate the page if Salesforce prompts you to.
On a record page, the widget shows only the report rows that belong to that record, such as one employee's data on an employee record. A report that can't be tied to the record shows This report can't be scoped to this record instead of data.
Scoping a widget to the page record only filters the report for relevance. It doesn't grant or restrict access: the widget runs the report as the viewer, so each viewer sees only the data their own Salesforce access allows.