View and export flair Reports
Every flair Report opens in the same viewer: a chart, a results table, and controls for the period, grouping, and chart type. This guide covers finding a report, adjusting what it shows, drilling into the records behind a number, and exporting the results.
HR Admins, Recruiters, and Managers in Salesforce with a flair permission set that includes the flair Reports tab, such as Flair Manager, Flair Employee Management, Flair Recruiter, Flair Hiring Manager, Flair Absence Manager, or Flair Attendance Manager. Each report shows only the records your Salesforce access allows.
Find a report on the Metrics tab
The Metrics tab lists every flair Report and the packaged Salesforce reports as tiles. Each tile shows the report's description, its category (HR or Recruiting), its type (flair or Salesforce), and its audiences. The tab comes with the Flair Manager and Flair Employee Management permission sets. With other flair permission sets, open reports from the flair Reports tab.
- Open the App Launcher (⋮⋮ grid icon), search for
Metrics, and open Metrics. - Optional: To show one subcategory, such as Headcount and turnover or Time & Attendance, click its tab. All shows every report.
- Optional: In Quick find, enter part of a report name, for example
absence. - Optional: In Type, select flair, Salesforce, or both. Only flair Reports are selected by default.
- Optional: In Audience, select the audience the report is meant for, such as Manager or Executive.
- Click a tile. A flair Report opens in a window on the same page. A Salesforce report opens in the Salesforce report viewer.
- Optional: To open the full report record, click Open report page. To return to the library, click Close.
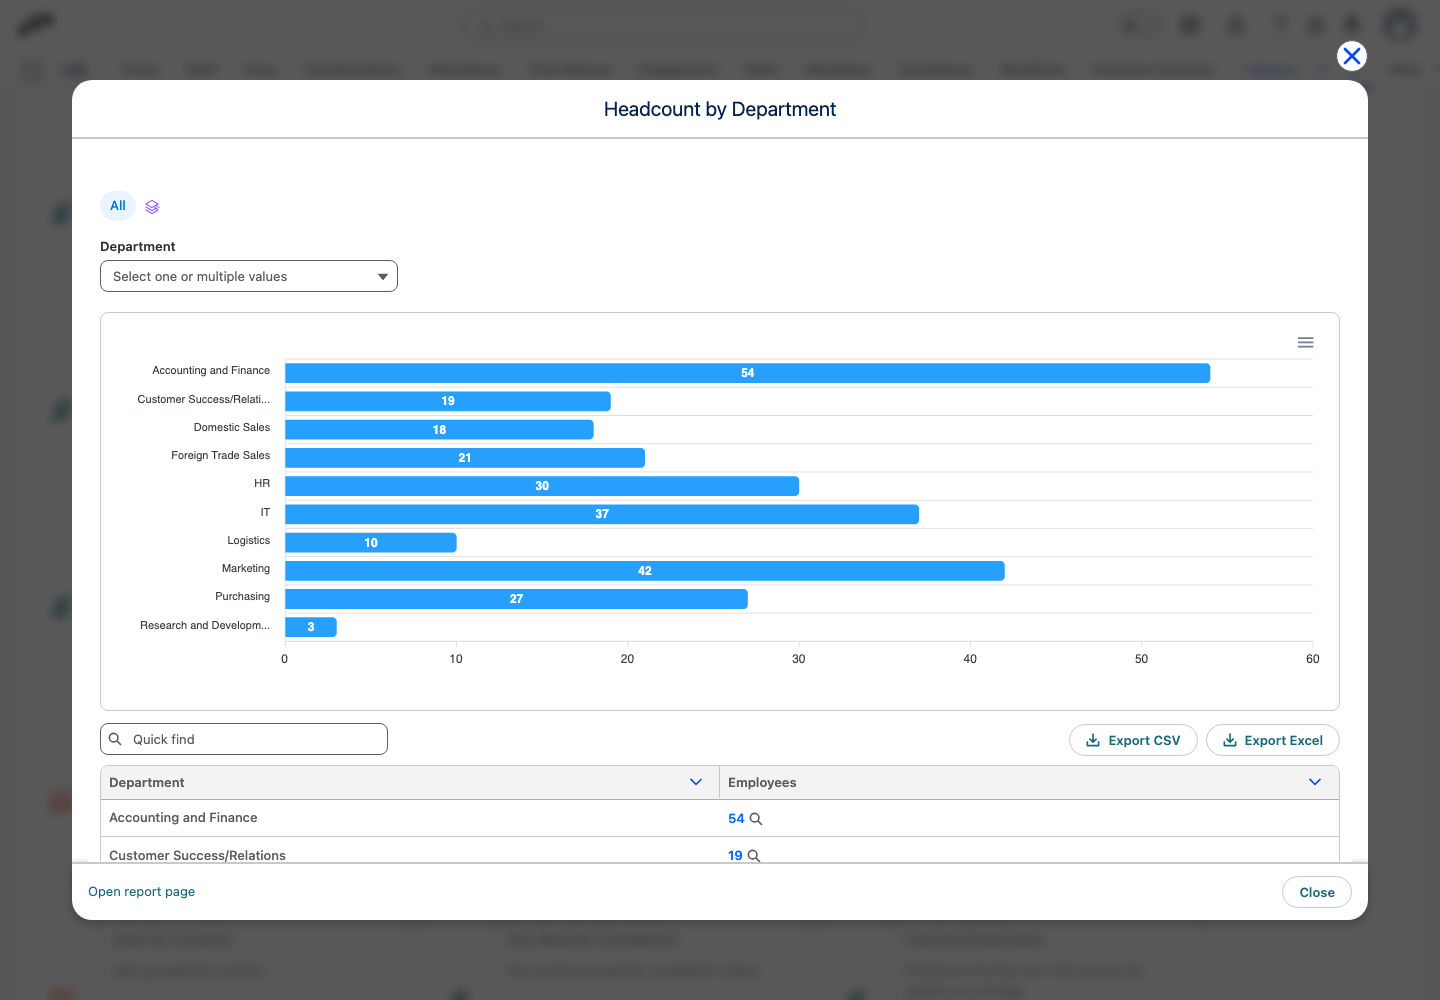
Open a report from the flair Reports tab
- Open the App Launcher (⋮⋮ grid icon), search for
flair Reports, and open flair Reports. - In the All list view, click a report name. The report record opens with the viewer on its first tab.
Change the period, grouping, and chart
The period, grouping, and chart settings are in the report's view settings. Which settings appear depends on how the report is built: a report over time shows period settings, and a grouped report shows chart settings.
- Next to All at the top of the report, click the stack icon (Save View). The view settings open for a new view, starting from the report's default settings.
- For a report over time, set Start period and End period. By default, a report shows the current calendar year.
- In Interval, select Monthly, Quarterly, or Annually. Some reports also offer Weekly or As of date (no breakdown).
- In Group by, select the field to group the results by, such as a department or a month.
- Optional: In Stack, select a second field to split each group into colored segments.
- In Measure, select the value to show, such as the number of new hires.
- In Chart type, select Bar, Column, Pie, Line, or Area. A report over time offers Line, Column, and Area, and Pie isn't available when the chart is stacked.
- Optional: To keep these settings, replace New view with a name, and click Save Changes. The view appears next to All.
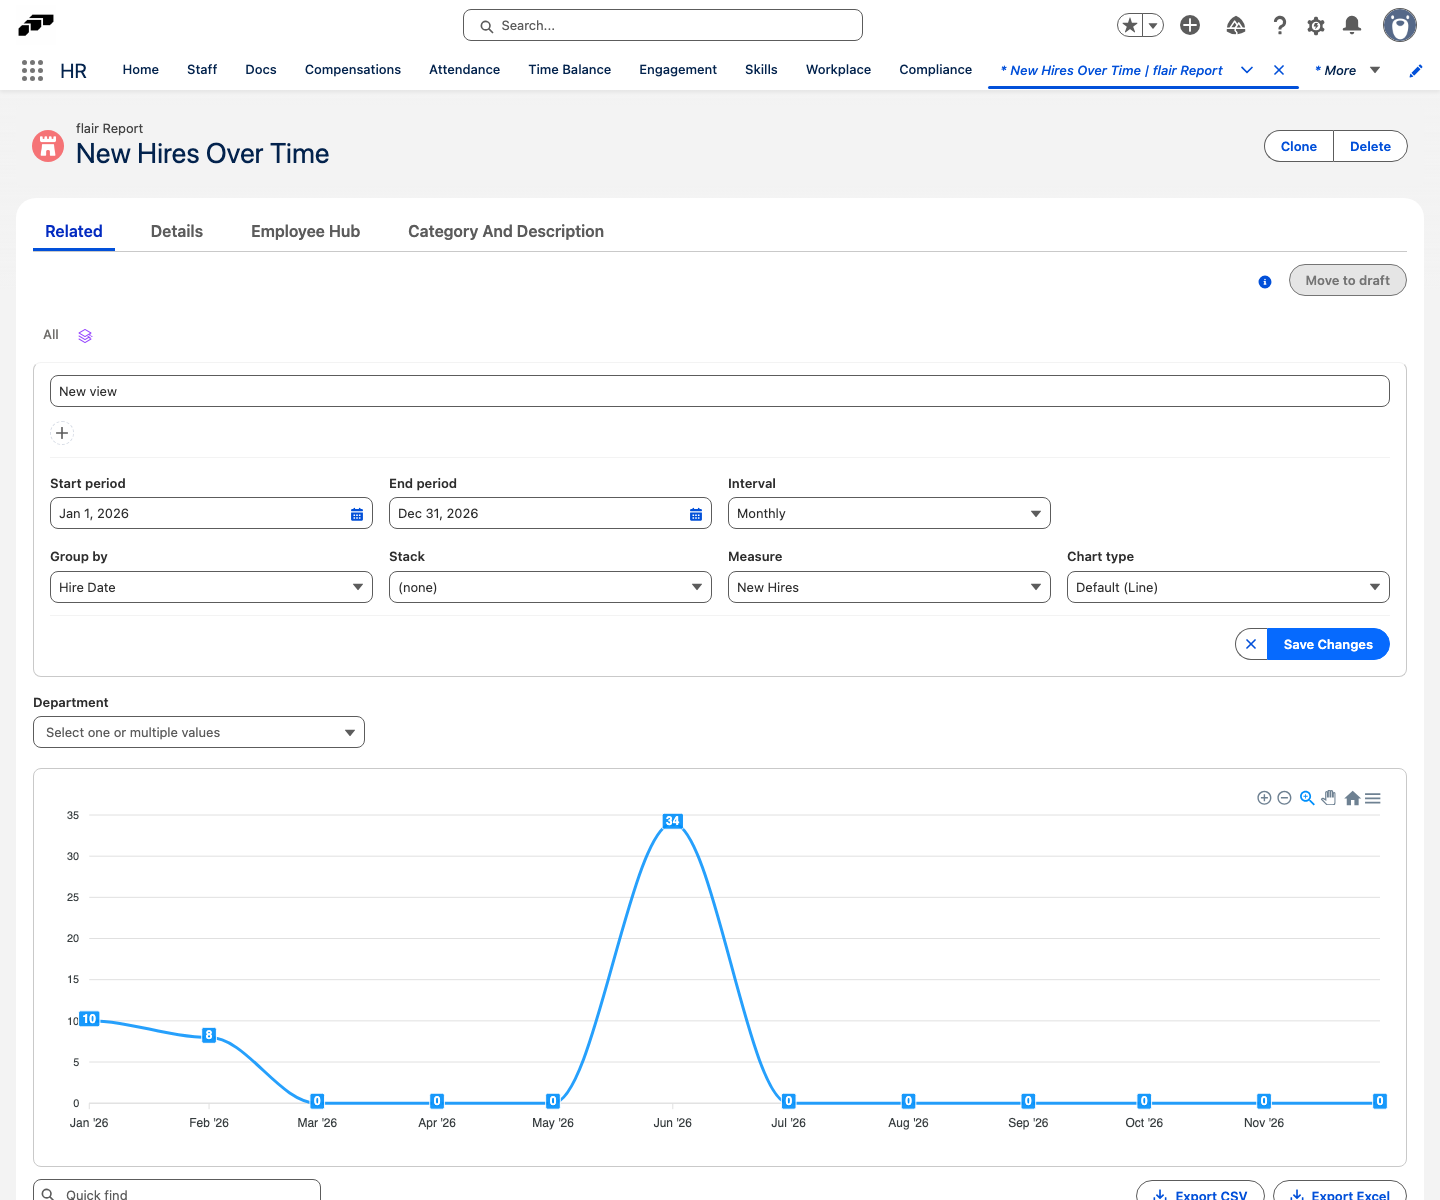
Filter the results
Reports can offer three kinds of filters:
| Filter | Where it is | What it does |
|---|---|---|
| Quick filters | Above the chart, for example Department | Limits the report to the values you select. The report's creator chooses which fields appear here. |
| Quick find | Above the table | Searches all rows of the report. |
| Views | Next to All at the top of the report | Saves the period, grouping, chart, and filter settings under a name, so you can switch back to them later. |
- To use a quick filter, open it, select one or more values, and close the list. The chart and table update.
- To search the table, enter text in Quick find.
- To switch between saved views, click a view name at the top of the report. Click All to return to the report's default settings.
See the records behind a number
- In the results table, find the row you want to inspect.
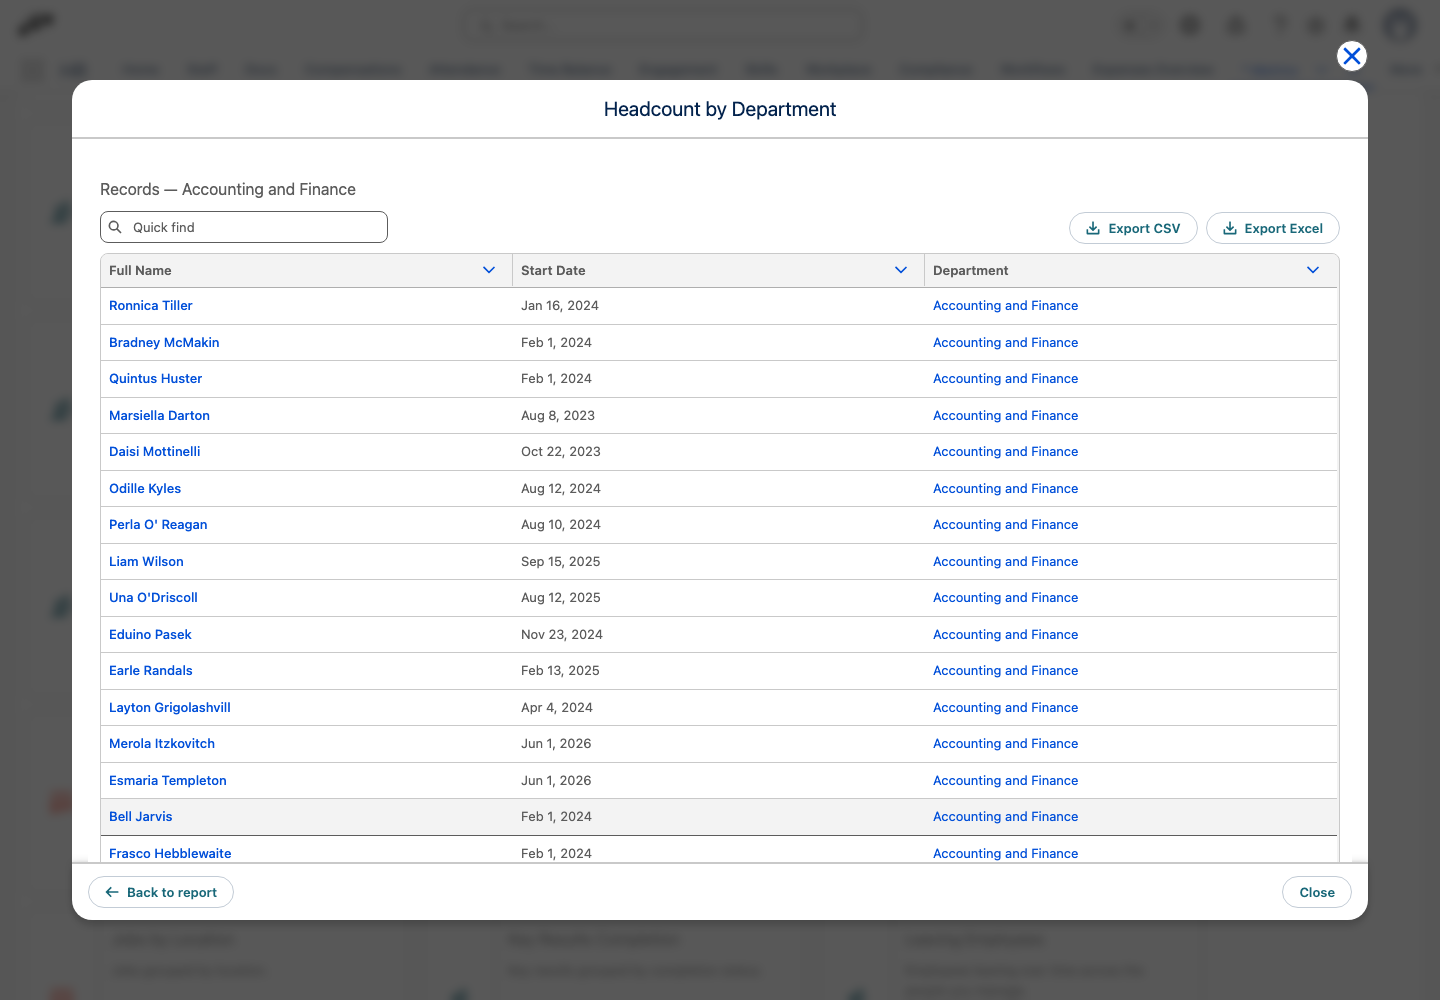
- Click the number next to the magnifying glass. The records that make up the value appear:
- On the report record, they open in the Records window.
- In the Metrics tab window, they replace the results, under Records and the name of the group.
- Optional: Search the records with Quick find, or export them with Export CSV or Export Excel.
- To return to the results, click Close in the Records window, or Back to report in the Metrics tab window.
Background reports don't offer this drill-down.
Export a report
- Open the report, and set the period, grouping, and filters you want to export.
- Above the table, click Export CSV or Export Excel. The file contains all rows that match the current period, filters, and Quick find search, not only the rows on the current page.
If a report is very large, flair shows Export incomplete and exports only the first rows. Narrow the period or add a filter, and export again.
Calculate a background report
Reports set to the Background calculation mode don't run every time you open them. Instead, they show the latest snapshot, which is useful for reports over large amounts of data. Packaged flair Reports always run live.
- Open the report. A report without a snapshot shows No snapshot yet.
- Click Calculate. The report shows Calculating… while the snapshot is built, which can take a few minutes.
- When the snapshot is ready, the report shows when it was calculated, for example Calculated 2 minutes ago.
- To update the snapshot later, click Recalculate.
A snapshot uses the report's default settings and the record access of the person who clicked Calculate, so filters and views aren't available on background reports. Viewing and calculating snapshots requires edit access to the report, which the Flair Manager, Flair Employee Management, Flair Recruiter, and Flair Recruitment Management permission sets grant.
Troubleshooting
The report shows No data to show
No records match the selected period and filters. Widen the date range, or clear the quick filters.
The report shows This report selects data you do not have access to
The report reads fields or objects that your permission sets don't grant. Ask your Salesforce Admin for the matching flair permission set, for example Flair Salary Manager for compensation reports.
A report isn't on the Metrics tab
Check the Type and Audience filters, then clear Quick find. If the Metrics tab shows Not every report is accessible, some reports aren't shared with you, and their tiles are disabled. Contact your Salesforce Admin.