Reports
With flair, you can apply Salesforce's powerful reporting functions to your HR data, giving you more detailed insights into your workforce.
You can create reports and save reports on any kind of people-related data, such as candidate application sources or employee salaries. There are also many filter and grouping options, allowing you to slice and dice the data however you need to.
How To Create a Report
To learn to create a basic report, let's use salaries as an example. These steps will show you how to create a report on employee salaries in different office locations and departments.
- To start off, open your flair HR or flair Recruiting app in Salesforce and click the App Launcher 𓃑. Use the search bar to find the Reports page.
- You will now see any reports that you have recently used. There are a number of standard, pre-built reports that come with flair, including Employees by Position, Number of Leaving Employees, and Candidate Application Source. Select All Reports to open and run these reports.
- To create a new report, click the New Report button.
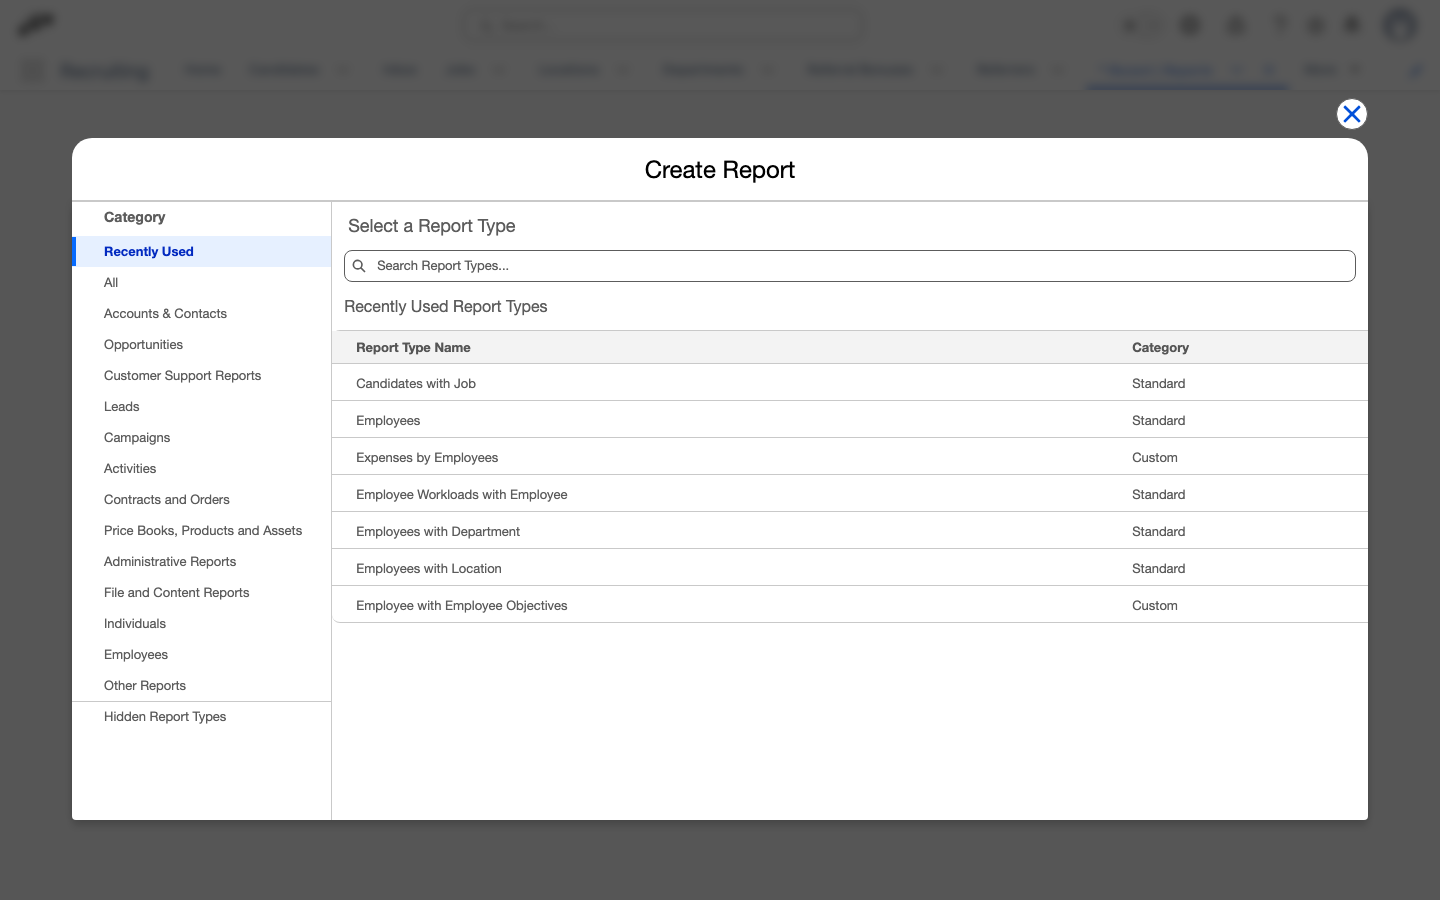
- A window will open showing you recently used Report Types. They are also grouped into categories in the menu bar on the left. Click All and type Salaries into the search bar to see all available reports related to salary.
- Choose a report. The report names contain the objects that the report will include. For example, if you want to report on employee salaries and include information about the employee such as department and location, you will need a report that includes two objects: Employee Salaries and Employee. In this case, select the report names Employee Salaries with Employee and then click Start Report.
- You will now see the Report Builder. Settings are on the left side of the screen and a preview of your report is shown in the middle. In the top-right corner of the Report Builder, activate the Update Preview Automatically toggle so you can instantly see changes as you build your report.
- On the left edge of the screen, you will see a vertical bar named Fields. Click on the arrow > to see all the Fields available for this report. Selecting a Field will add it to your report.
Adding and Hiding Columns
If you want to add more information to your report, you can use the Add Column search bar to find fields related to the objects included in your report.
In our example report, Employee Salaries and Employee, you will start off with two columns: Employee Salary ID and Employee Full Name. For the purposes of our report, the Salary ID is not important. To hide it, find the Employee Salary ID field in the Columns section of the settings bar on the left. Click the X to remove it.
Use the Add Column search bar to find and add new fields to your report. In this example, we will add Amount, Employee Country, Employee Department, and Type of Employment. If you want to change the order in which the columns are displayed, simply click on the header row of the column you want to move and drag it to a new location.
Grouping Rows
Now that you have added all the information you need in your report, you can group rows to make the information easier to view. In our salary report example, you could use groups to view employee salaries in each country.
There are two ways to group rows. The easiest way is to click the down arrow ▼ in the header row of the field you want to group and then select Group Rows by This Field. Alternatively, you can use the Add Group search bar in the left-side menu to search for the field you want to group.
In our example, we have grouped the rows by Employee Country. This moves the Employee Country field to the left of the table, shows the number of records per country, and calculates the subtotal salary in the in Amount column.
After grouping your rows, you will see additional options at the bottom of the screen.
- Row Counts: Displays the number of rows/records per group
- Detail Rows: Displays each individual row. Deactivating this option will hide the individual rows, showing you only the subtotals of columns containing numerical values and Record Count.
- Subtotals: Adds the subtotal of numerical records to each group.
- Grand Total: Adds the grand total of numerical records to the bottom of the table.
For this example, we will deactivate the Row Counts option.
In columns that contain numerical values, such as the Amount column, you can choose what appears in the Subtotal and Grand Total rows. By default, a sum is shown. To change this, click the down arrow ▼ in the header column and select Summarize. You will see five options: Sum, Average, Max, Min, and Median. In our example, we will select Average to show the average salary amount per country.
Grouping Columns
Once you have grouped rows by a particular field, you will also have the option to group columns. This works the same as grouping rows: You can either click the down arrow ▼ in the header row and select Group Columns by This Field or use the Group Columns search bar in the left-side menu under Groups.
In our example, we're going to group columns by Type of Employment. Doing this will transform your table, showing you the average salary per type of employment in different countries.
When grouping by rows and columns, the Subtotals option at the bottom of the screen will disappear. In its place, you will find the Stacked Summaries option, which can make information easier to view in complex reports. In this example, we have deactivated the option.
To learn more about customizing report views in Salesforce, visit the Salesforce Help Center.
Reports grouped by rows and columns are also know as a matrix. When working with this kind of report, you will see an additional view named Details beneath your table in the report preview. This displays additional information not included in your matrix. In our example, the Details view included the individual salary amounts, the employees' full names, and the departments.
Clicking on an individual cell in your matrix will show you a breakdown of that information in the Details view. This is useful if you want to see the individual values that make up a specific sum or average.
Adding Filters
You can also add a wide range of filters to refine your reports. To start, select the Filters tab in the settings menu on the left side of the screen.
In our example, the default filters are My Employee Salaries and End Date: All Time. By clicking on the filter, you can change it. For example, you can change My Employee Salaries to My Team's Employee Salaries or All Employee Salaries. You can also set a date range.
Using the Add Filter search bar, you can apply new filters to your report. For instance, up until now, our example salary report has been showing all salaries. If you only want to include the salaries of employee still at your company, you could search Active, select Employee: Active, choose True, and click Apply. You could also filter out certain countries, departments, or types of employment, if needed.
Save and Run a Report
When you're happy with your report, click Save and give your report a name and description. You can also choose a folder, depending on whether you want to share the report with other colleagues or keep it in your private folder.
Clicking Run will give you the final results of your report.